Unlock cost-effective observability with native OpenTelemetry

Gain a clear, unified view of all your resources across domains and vendors
Leaders trust OpenText
Capabilities
Meet powerful, cost-effective observability, enabled by OpenTelemetry
Fast instrumentation and setup
Use the OpenTelemetry libraries to compile with apps. Deploy the industry-standard collector—or, if you're running OpenText™ AI Operations Management, deploy the collectors with our existing agents.
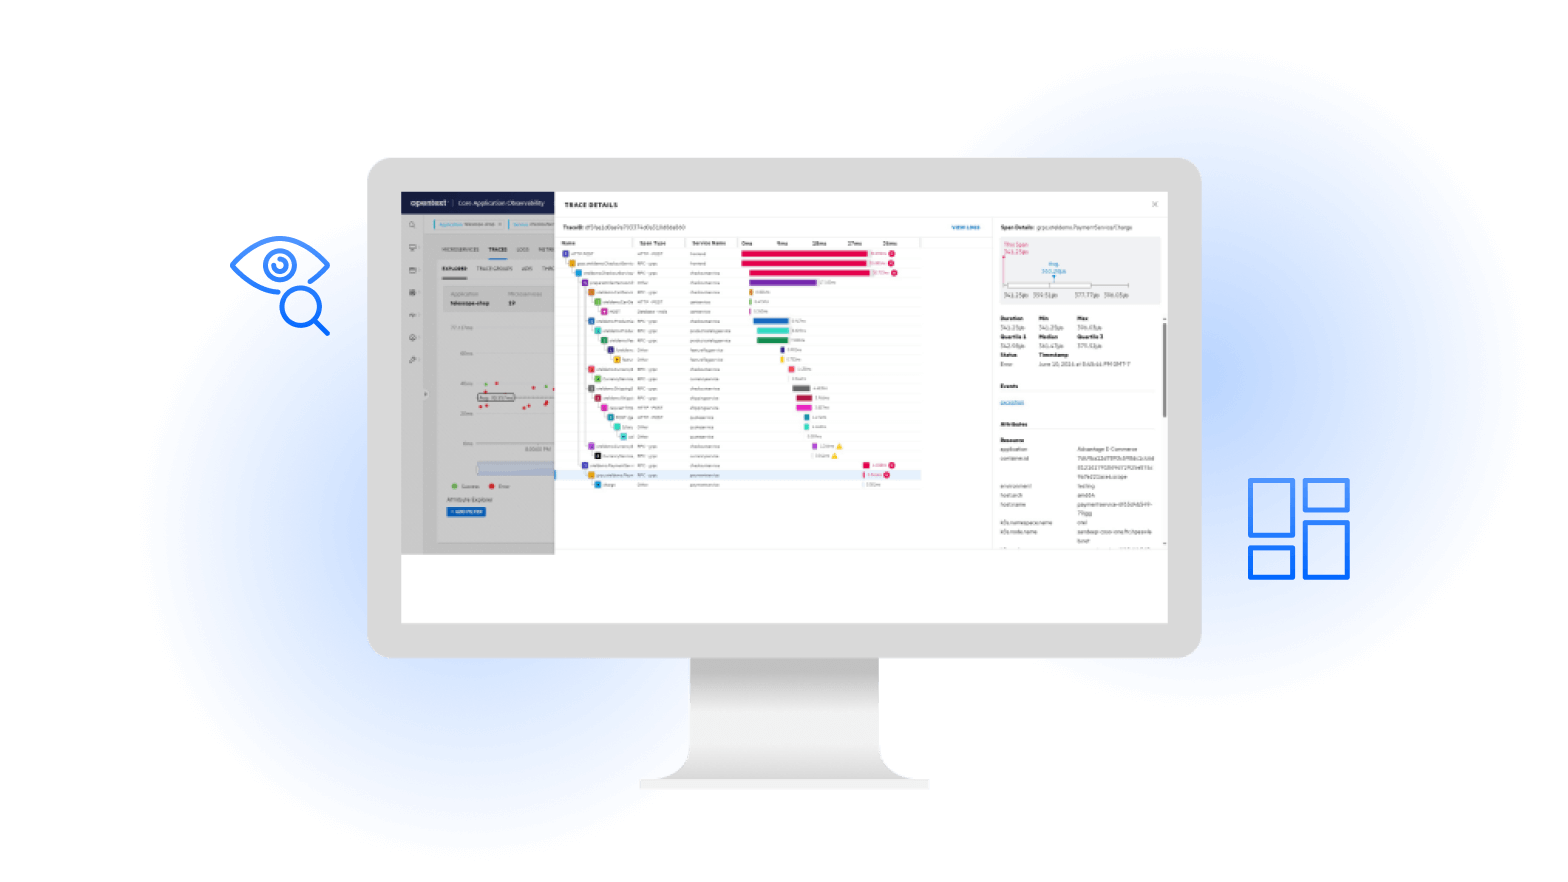
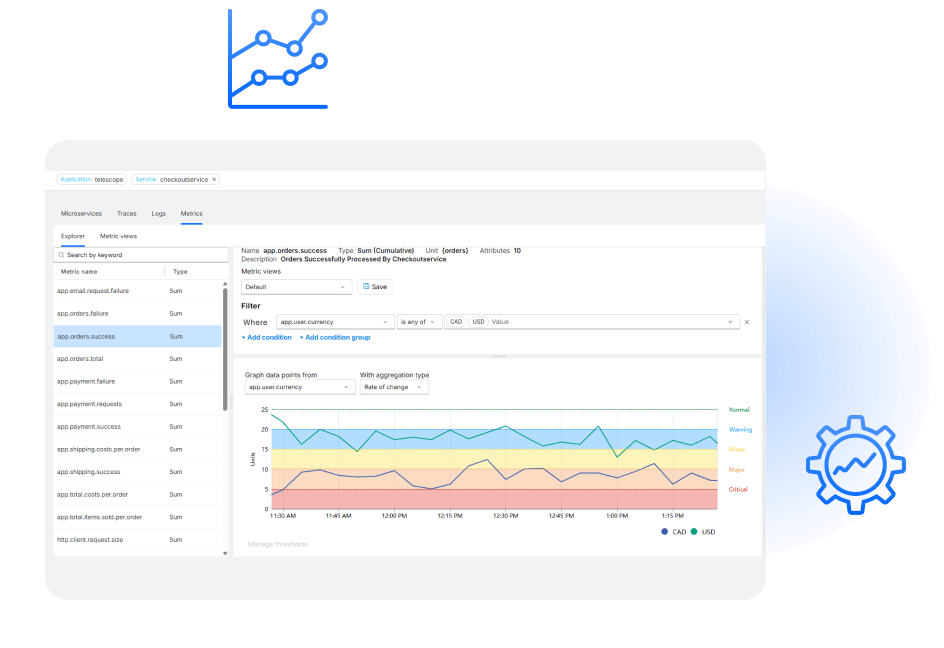
Insights powered by OpenTelemetry
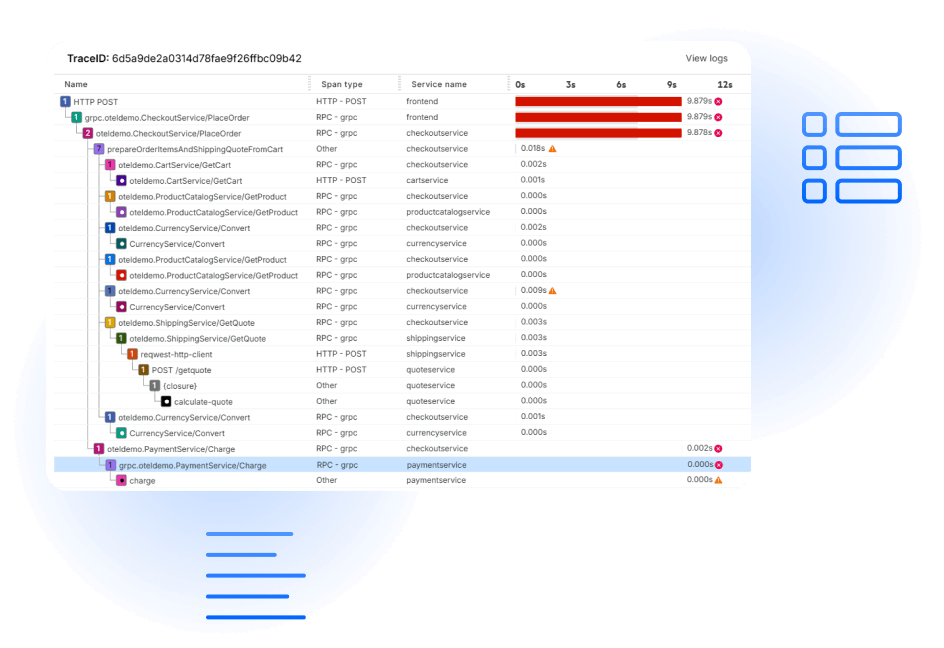
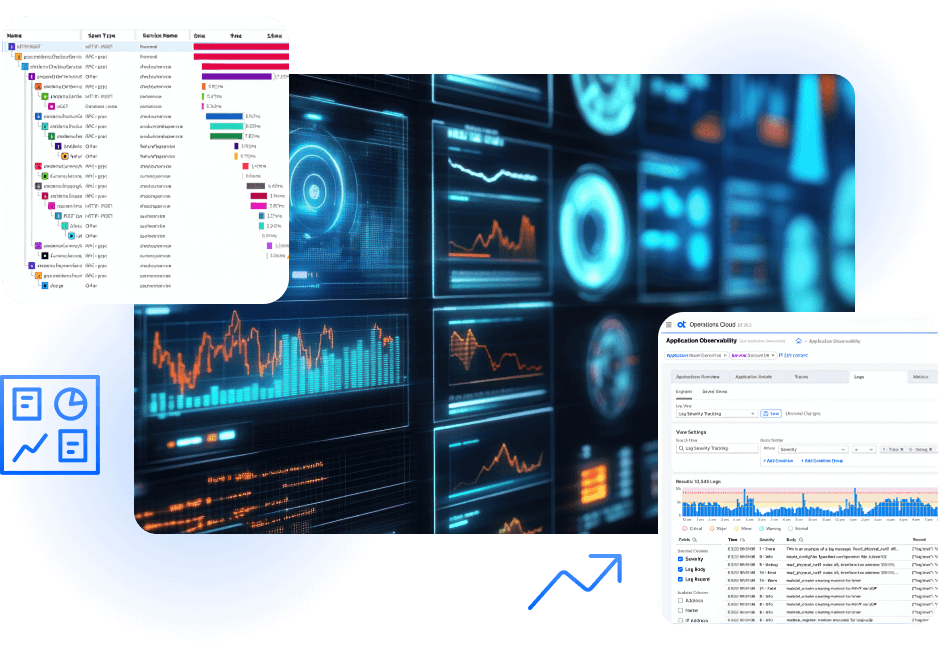
Deliver immediate OpenTelemetry-driven insights via correlated metrics, events, and logs within application traces. See a slow transaction? Click in to understand related events and logs-and capture metrics to quickly track and identify future events.

Cost control
Extend your visibility across more applications using a cost-effective observability tool with predictable pricing. Start enjoying productivity-boosting insights without budget surprises.

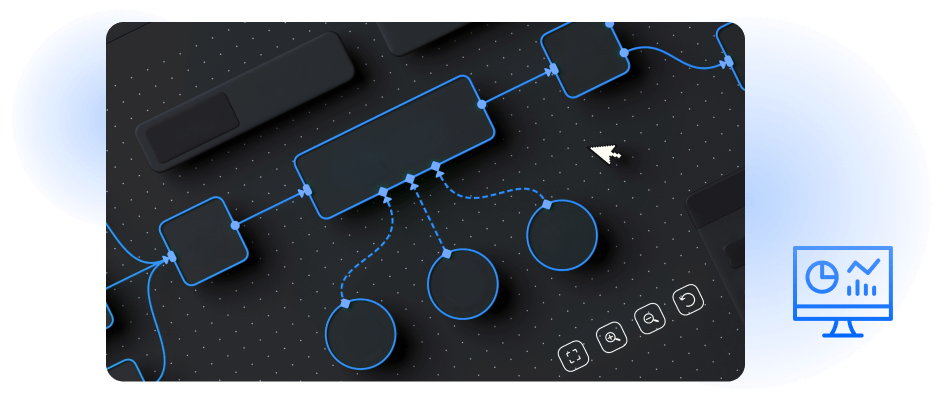
Pinpoint potential performance issues with AI
Capture high-density anomaly bursts and compare to normal for instant insights.


Benefits
Why choose OpenText Core Application Observability?
Instrument once, analyze anywhere
Enable the use of role-specific toolsets with our OpenTelemetry-based observability platform.
DemoRequest a demo

Resources
Everything you need in one place
Request a demo of OpenText Core Application Observability